eProofficials

Results

What actually moved, account by account.

Every figure below is read off the account's own Seller Central, Amazon Ads or Sellerboard dashboard. Client names and ASINs are withheld; the numbers are not.

  • Every figure read off the account’s own dashboard
  • Names withheld, numbers unaltered
  • Outliers labelled as outliers
  • None of it is a forecast
Advertising cost of sale against contribution margin A scatter of products in one account. Those left of the break-even line still contribute margin after advertising. Those right of it are bought at a loss. A single blended ACoS hides both groups. Advertising cost of sale → Contribution margin ↑ Break-even margin Break-even ACoS
Still contributing margin Buying revenue at a loss

01 — Profit and margin

When the problem was never sales.

Three accounts that were already turning over money. What they were not doing was keeping it.

Case 01  ·  US  ·  Food and grocery

Nearly four times the monthly profit, on less ad spend.

$784 → $3,630

Monthly net profit

5% → 19%

Net margin

−42%

Monthly ad spend

Flat

Revenue, throughout

The situation

A US food and grocery account turning over roughly $15,000 to $20,000 a month across 1,000 to 1,250 orders, at a $15 to $18 average order value. In February it did about $14,800 in sales and kept $784 of it — a 5% net margin, with advertising consuming around 16% of every dollar. Strong top line, almost none of it reaching profit. In food, where unit margins are thin to begin with, every wasted click is felt.

What we did

  • Pulled search-term and Brand Analytics data first, to separate the terms taking clicks without converting from the few quietly carrying the account.
  • Cut spend on the dead clicks and protected the winners, rather than trimming bids across the board.
  • Read the placement report and moved budget off top of search, where it was overpaying, into placements converting at lower cost.
  • Added day parting to stop spend during the hours that never converted.

The result

Ad spend fell from about $2,930 to $1,700 a month while sales held at $19,000 to $20,000. Net profit climbed $784 → $2,306 → $2,606 → $3,630 over the following months, and net margin widened from roughly 5% to 19%.
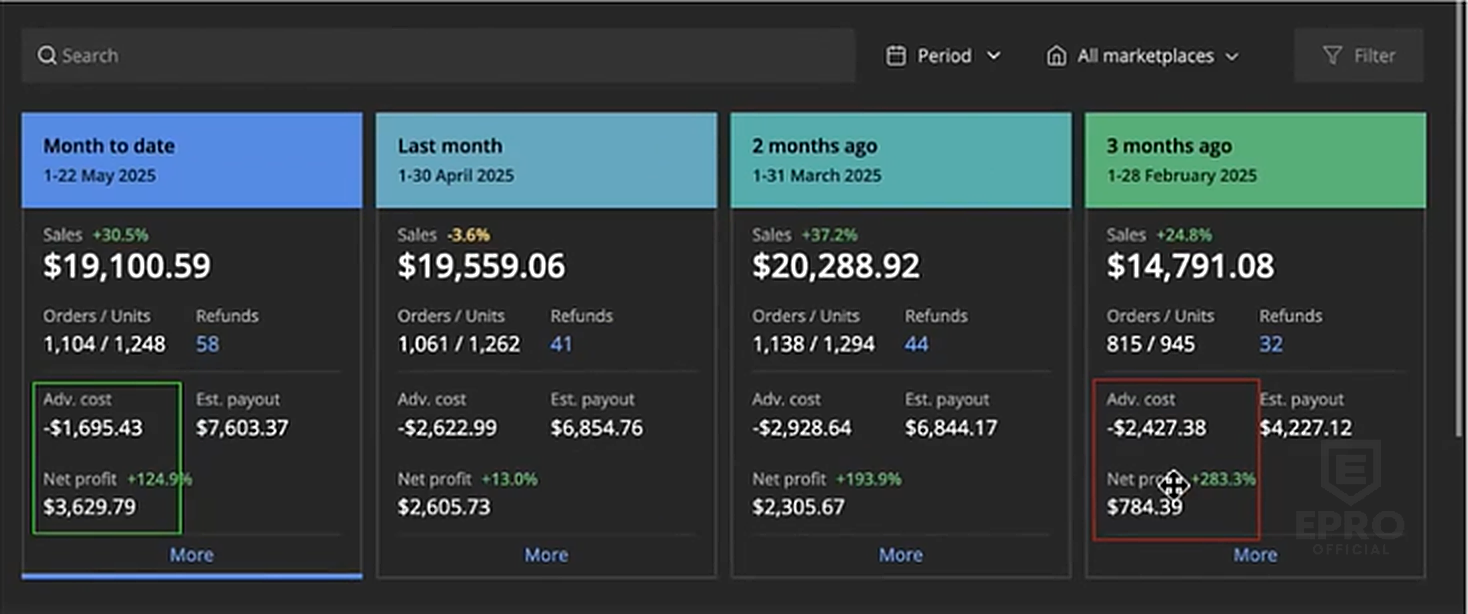
Sellerboard comparison from February to 22 May 2025 showing sales growth and net profit rising from $784.39 to $3,629.79.
Sellerboard, February to May 2025. The May column is month-to-date, 1–22 May, not a completed month.

The lever was never more sales. It was stopping the account from spending into the ground.

Source: the account's Sellerboard dashboard. Brand identifiers removed for confidentiality.
Case 02  ·  US  ·  Supplements

Break-even to about $4,900 a month, in two months.

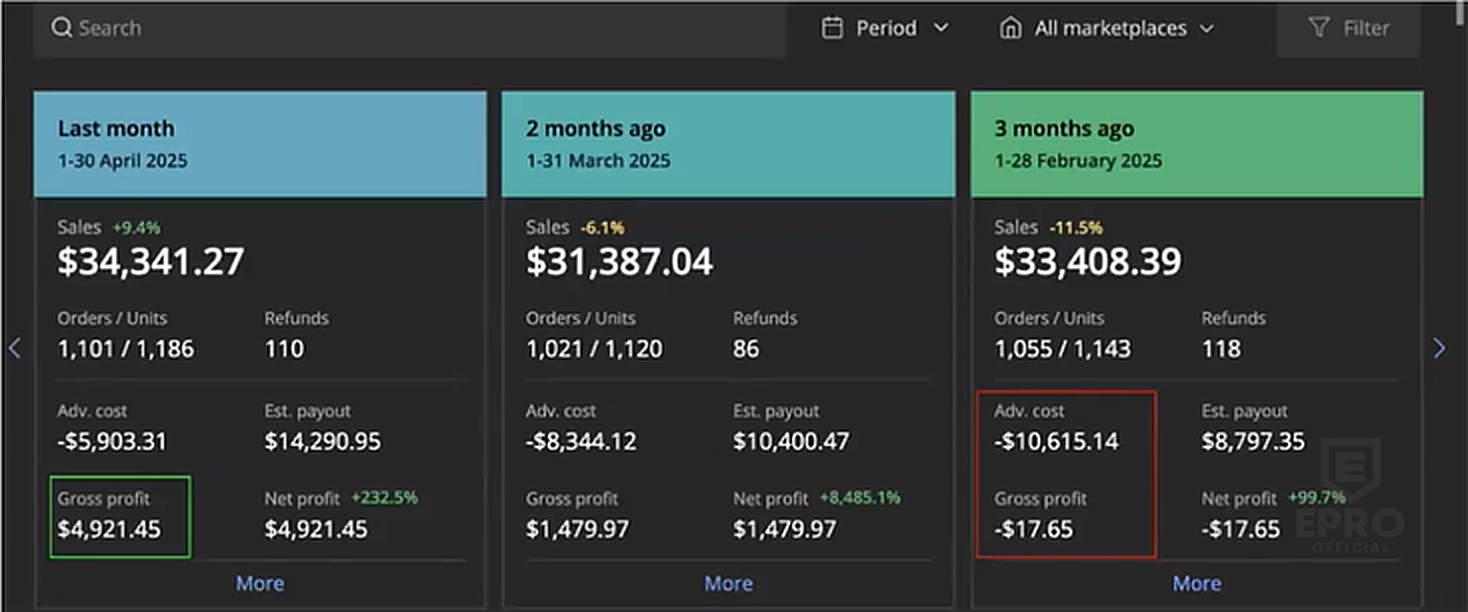
−$18 → $4,920

Monthly net profit

−45%

Ad spend, $10.6K → $5.9K

32% → 17%

Ad cost as a share of revenue

+$0.9K

Sales, which still grew

The situation

A US supplement account doing $31,000 to $34,000 a month across about 1,100 orders at a $29 average order value. In February advertising was eating around 32% of revenue and profit sat at roughly zero. High volume, no margin — the kind of account that looks healthy on a sales report and quietly bleeds on the P&L. In a trust-heavy category like supplements, that usually means paying for clicks the listing was not yet built to convert.

What we did

  • Identified the campaigns carrying the waste — mostly broad and auto targets spraying budget — and cut them back hard while keeping the exact-match terms driving real orders.
  • Rebuilt around the keywords with the best click-through and conversion rates using search-term and Brand Analytics data, instead of funding every target equally.
  • Tightened placements and bids so spend followed conversion rather than impressions.

The result

Ad spend came down from about $10,600 to $5,900 a month, a 45% cut, while sales grew slightly, from $33,400 to $34,300. Advertising fell from around 32% of revenue to 17%, and monthly profit moved from −$18 to about $1,480 to about $4,920.

Sellerboard comparison showing advertising cost falling from $10,615.14 in February to $5,903.31 in April while net profit rises to $4,921.45.
Sellerboard, February to April 2025 — advertising cost falling while net profit recovers.

Cutting spend is easy. Cutting it without losing the sales is the whole game.

Source: the account's Sellerboard dashboard. Brand identifiers removed for confidentiality.
Case 03  ·  EU  ·  Home decor

Four and a half times the volume in a month, with margin held.

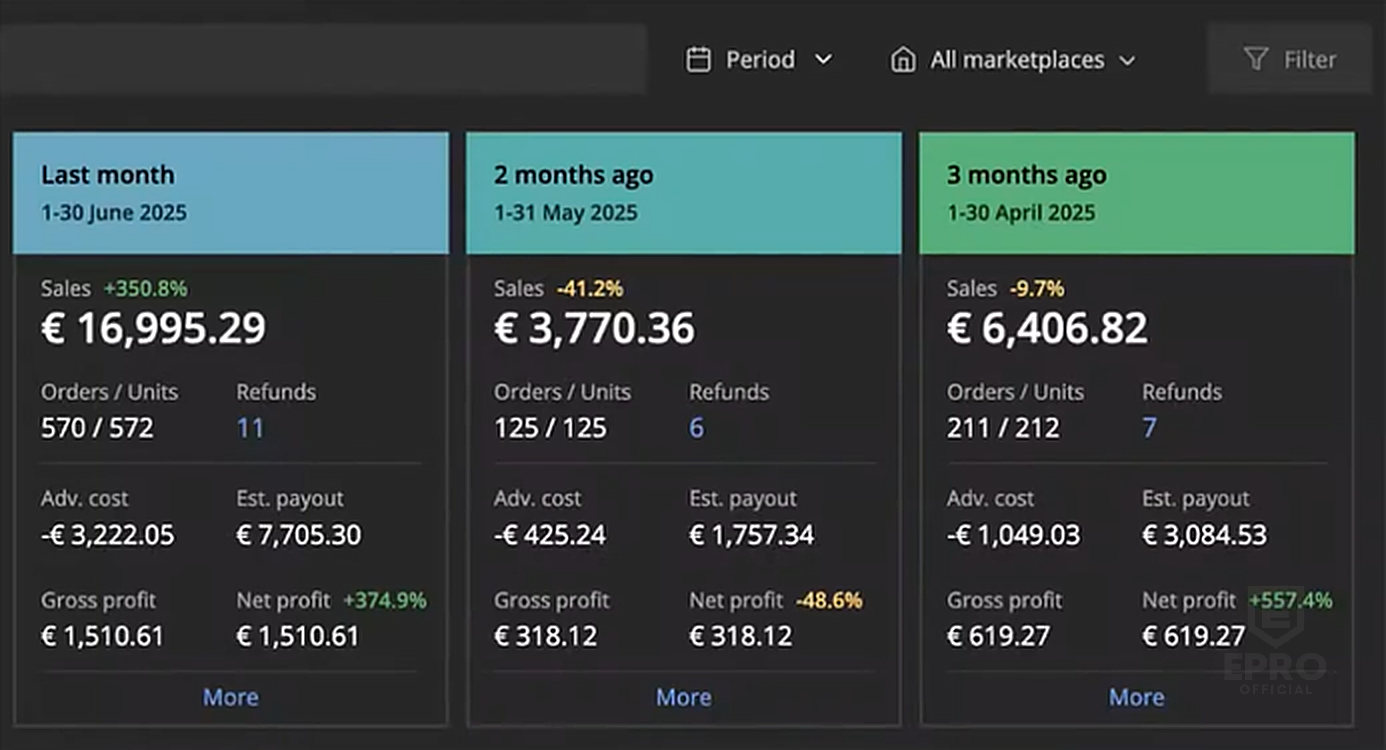
€3.8K → €17K

Monthly sales, May to June

570

Orders in the scaling month

€1,510

Net profit, same month

~9%

Net margin, held through the push

The situation

An EU home decor account with a roughly €30 average order value, running modestly through spring — around €6,400 in April and a slow €3,800 in May. The catalogue and the demand were both there. The advertising was only addressing a small core of terms it already knew.

What we did

  • Expanded into new converting search terms identified from Brand Analytics, beyond the handful the account had been relying on.
  • Layered in Sponsored Display audience segments to bring in new-to-brand buyers rather than only recapturing existing demand.
  • Scaled spend in step with sales while watching TACoS, so the growth stayed profitable instead of bought.

The result

June reached about €17,000 in sales and 570 orders — roughly 4.5 times May's volume — with net profit near €1,510 and ad spend held at around 19% of sales, so margin stayed close to 9% through the push.

Sellerboard comparison showing June 2025 sales of €16,995.29, 570 orders and €1,510.61 net profit.
Sellerboard, April to June 2025 — June sales, orders, advertising cost and net profit.

Scaling 4.5x in a month usually wrecks efficiency. Holding margin while doing it means the structure underneath was already sound.

Source: the account's Sellerboard dashboard. Brand identifiers removed for confidentiality.
02 — Advertising efficiency

Spend that had to justify itself.

Four campaigns run to four different mandates — lowest possible cost, held ACoS, sustained margin on high-ticket, and deliberate customer acquisition. The target was agreed before the first bid was set.

Case 04  ·  US  ·  Sponsored Display

$350,445 in sales from $3,199 of ad spend.

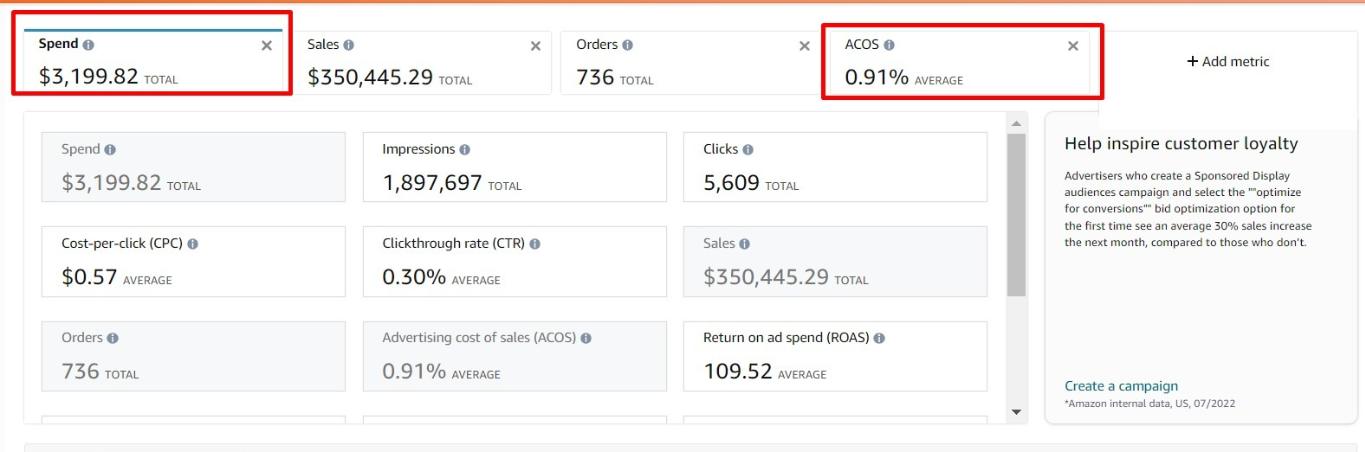
$350,445

Attributed sales

0.91%

ACoS

109.5x

ROAS

736

Orders

The situation

A US seller wanted volume from Sponsored Display without the budget that normally comes with it. Display is the format most often written off as a branding line item; run against purchase behaviour rather than impressions, it behaves very differently.

What we did

  • Built audience segments from purchase behaviour and product-view data instead of broad category targeting.
  • Applied aggressive negative targeting to strip out impressions that would never convert.
  • Adjusted bids daily against conversion data and the agreed ACoS ceiling.
  • Tracked CPC trend at a $0.57 average and moved budget to protect ROAS as it shifted.

The result

$3,199.82 in spend returned $350,445.29 in attributed sales across 736 orders — a 0.91% ACoS and 109.52x ROAS, from 1,897,697 impressions and 5,609 clicks at a 0.30% click-through rate.

View supporting screenshot

An outlier, and we say so. It is what disciplined audience targeting can do when the product and the audience genuinely match — not a number to expect.

Source: Amazon Ads campaign manager, US marketplace.

Case 05  ·  US  ·  High-ticket home and lifestyle

$112,497 in two months at an 11.26% ACoS.

$112,497

Ordered product sales, Apr–May 2026

11.26%

ACoS across the period

$228.65

Average order value

420+

Active listings managed

The situation

A US seller in high-ticket home and lifestyle goods, priced $200 to $340 and up, fulfilled by merchant, running 420 active listings with another 106 in draft. At that price point a single wasted click costs what an entire order is worth in most categories, and conversion rate carries far more weight than impression share.

What we did

  • Ran the full Seller Central account alongside the advertising — listings, inventory, pricing and shipping templates.
  • Built and optimised campaigns across Sponsored Products, Brands and Display against a margin-derived ACoS target rather than a category benchmark.
  • Held listing quality to the standard a $200-plus price point demands, since conversion is what makes the ACoS target reachable at all.
  • Kept 106 drafts moving through the pipeline so catalogue expansion did not stall behind the advertising work.

The result

$112,497.85 in ordered product sales across 492 orders and 702 units over two months. $4,497.69 in ad spend returned $39,931.97 in directly attributed PPC sales, with a further $44,026.95 in long-term attributed sales, at an 11.26% ACoS.

On high-ticket, the advertising target is set by the margin, not by what the category averages.

Sources: Amazon Seller Central sales dashboard and Amazon Ads campaign manager, 1 April to 31 May 2026. Product names and ASINs redacted.

Case 06  ·  UK  ·  Sponsored ads

Two consecutive months inside a 0.3-point ACoS band.

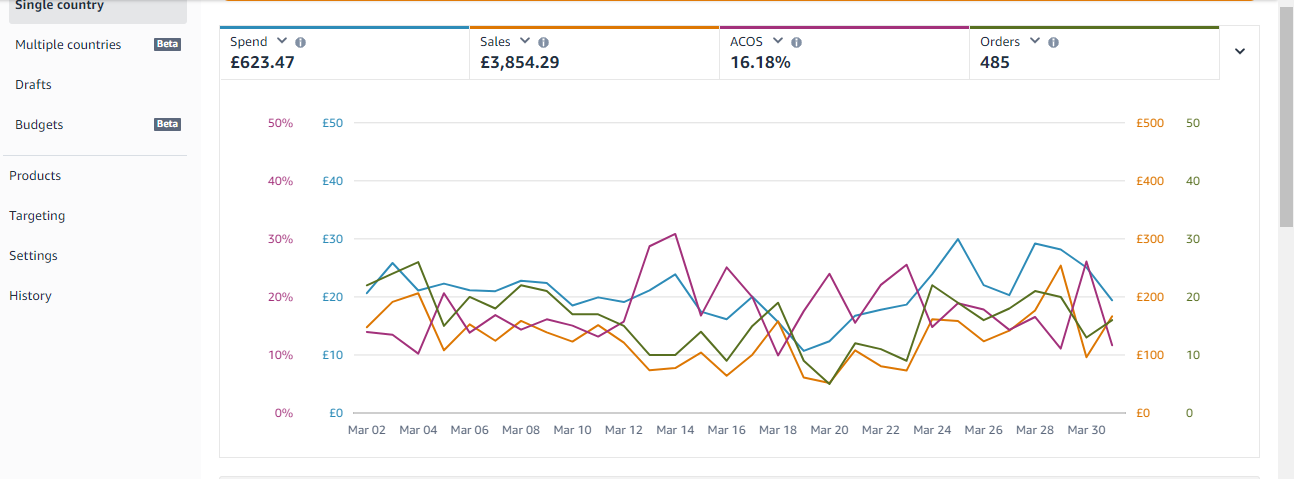
16.18%

March ACoS

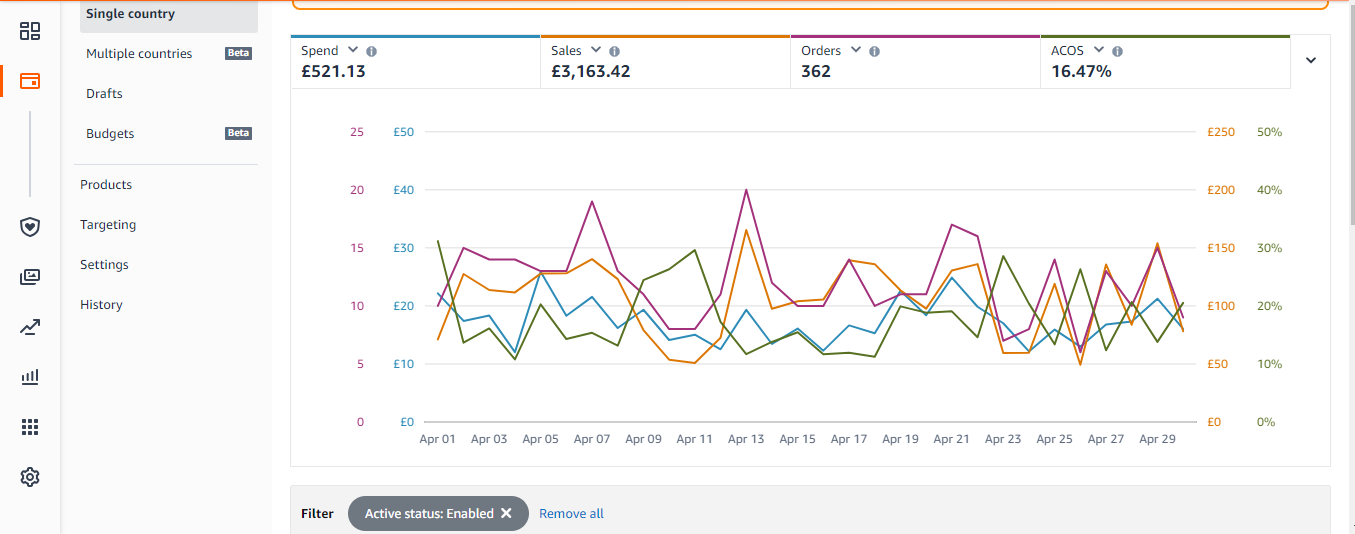
16.47%

April ACoS

£7,017

Combined sales

847

Combined orders

The situation

A UK seller wanted profitable advertising held below 20% ACoS while order volume grew. The interesting number here is not how low the ACoS went — it is how little it moved. Consistency month to month is what makes a marketing budget plannable.

What we did

  • Ran Sponsored Products, Brands and Display together on the UK marketplace rather than treating each as its own silo.
  • Held ACoS below 17% through daily bid adjustment and continuous negative keyword work.
  • Reviewed search-term reports weekly to expand profitable keywords and cut waste before it compounded.
  • Scaled into March's peak demand without letting efficiency slip in the process.

The result

March: £623.47 spend, £3,854.29 sales, 16.18% ACoS, 485 orders. April: £521.13 spend, £3,163.42 sales, 16.47% ACoS, 362 orders. Combined: £1,144.60 spend against £7,017.71 in sales and 847 orders.

View supporting screenshot — March View supporting screenshot — April

A good month is luck. Two months inside a third of a percentage point is a system.

Source: Amazon Ads campaign manager, UK marketplace, March and April 2024.

Case 07  ·  US  ·  Customer acquisition

93% of orders came from people who had never bought the brand.

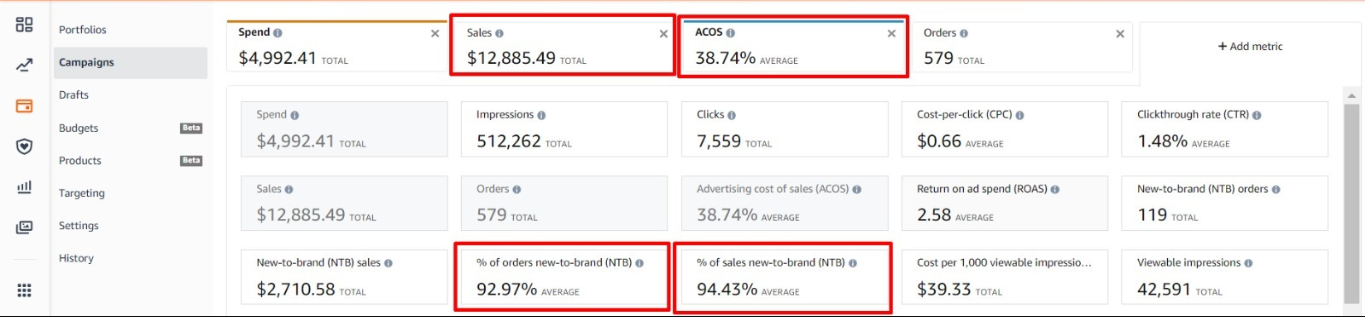
92.97%

New-to-brand orders

94.43%

New-to-brand sales

$12,885

Attributed sales

579

Orders

The situation

This account was not run for efficiency, and the reporting says so plainly: a 38.74% ACoS is a deliberate acquisition cost, not a miss. The brief was reach — buying first-time customers at a known price rather than re-buying the ones already converting on their own.

What we did

  • Structured campaigns specifically to maximise new-to-brand reach rather than blended ACoS.
  • Targeted broad and phrase match to capture new shopper intent instead of harvesting existing demand.
  • Ran Sponsored Brands for visibility at the top of search, and product targeting to intercept shoppers on competitor listings.
  • Tracked new-to-brand metrics weekly and adjusted targeting to hold acquisition above 90%.

The result

$4,992.41 in spend returned $12,885.49 in sales across 579 orders at a 2.58x ROAS and 38.74% ACoS, from 512,262 impressions at a $0.66 average CPC. Amazon attributed 92.97% of the orders and 94.43% of the sales to new-to-brand customers.

View supporting screenshot

A 38% ACoS is a failure if the goal was efficiency and a bargain if the goal was a customer base. Agreeing which one you are buying is the job.

Source: Amazon Ads campaign manager, US marketplace.

03 — Operations and catalogue

The floor everything else stands on.

None of these are advertising projects. All of them decided what the advertising was capable of.

Case 08  ·  US  ·  Full account management

$413,270 in ordered product sales across twenty days.

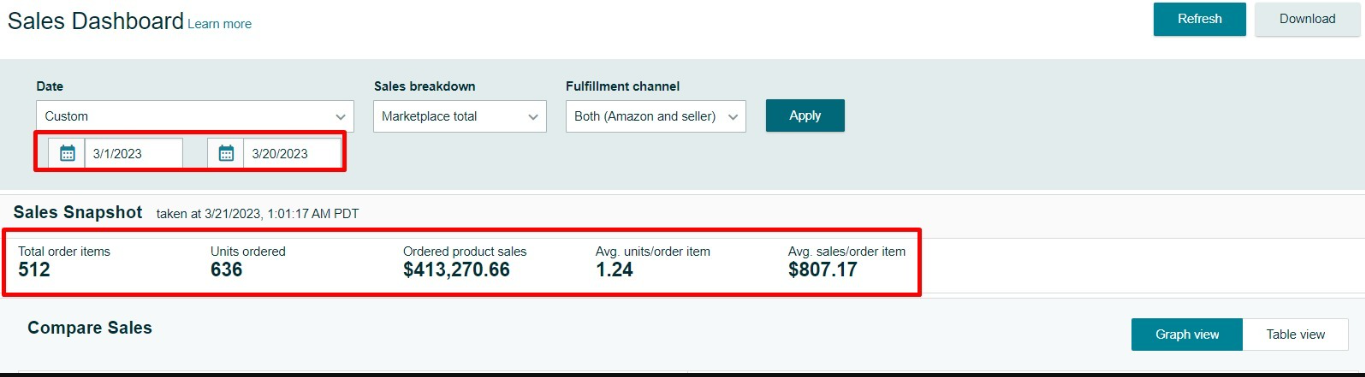
$413,270

Ordered product sales, 20 days

512

Order items

636

Units

$807

Average per order item

The situation

A high-volume US seller in a peak sales window, at an $807 average order value — well above marketplace norms. At that velocity the risk is not the campaigns. It is a stockout, a Buy Box loss or a suppressed listing going unnoticed for six hours.

What we did

  • Ran the whole Seller Central account through the window — campaigns, listings, inventory and orders as one job rather than four.
  • Watched daily sales velocity and adjusted bids to sustain momentum instead of setting and forgetting.
  • Held listing health, Buy Box eligibility and pricing competitiveness under constant review.
  • Coordinated inventory to prevent a stockout during the period, and flagged anomalies the same day they appeared.

The result

$413,270.66 in ordered product sales from 512 order items and 636 units between 1 and 20 March 2023, at $807.17 per order item and 1.24 units per order.

View supporting screenshot

At $807 an order, the job during a peak is not growth. It is making sure nothing breaks.

Source: Amazon Seller Central sales dashboard, 1–20 March 2023.

Case 09  ·  US  ·  Catalogue operations

2,664 active SKUs, none of them suppressed.

2,664

Active SKUs under management

100%

Active listing status maintained

250

SKUs per bulk action

FBA + FBM

Mixed fulfilment

The situation

A catalogue of 2,664 active listings on Amazon US, mixed between FBA and merchant fulfilment. At this size the failure mode is not dramatic. It is fifty listings quietly going inactive over a quarter and nobody noticing until the revenue report does.

What we did

  • Created and updated listings in bulk with flat-file templates, processing up to 250 SKUs in a single action.
  • Held 100% active listing status across the catalogue — zero suppressed, zero inactive.
  • Managed pricing and Featured Offer eligibility catalogue-wide rather than listing by listing.
  • Ran quality checks on content, images and compliance, and handled FBA and merchant-fulfilled inventory tracking and reorder planning.

The result

A catalogue where bulk changes that would otherwise take weeks were completed in a sitting, and where every listing stayed active, Featured Offer eligible and competitively priced.

View supporting screenshot

Flat files are unglamorous. They are also the difference between a catalogue you manage and a catalogue that manages you.

Source: Amazon Seller Central, Manage Inventory. Product names and ASINs redacted for confidentiality.

Case 10  ·  US  ·  FBM shipping architecture

A $90 overnight label, and the system that replaced it.

500+

SKUs brought into one framework

5

Size tiers replacing per-SKU templates

10oz – 110lb

Weight range covered

MAP-locked

Pricing constraint throughout

The situation

A San Diego audio seller came to us after paying $90 to ship a single overnight package to the East Coast. With 500-plus SKUs, MAP-locked pricing and boxes ranging from poly bags to 110 lb subwoofers, shipping cost was unpredictable and margin was leaking on anything crossing state lines. A template per SKU was never going to scale.

What we did

  • Grouped the entire catalogue into five size tiers by box dimension, then layered a regional zone strategy over the top.
  • Bought aggressive one- and two-day speeds close to origin to win the Buy Box where it was affordable, and cost-controlled ground service to distant zones to protect margin.
  • Mapped each tier to the right carrier — USPS Ground Advantage for accessories, Priority for small parcels, UPS Ground for heavy gear.
  • Built in a hard out-of-pocket cost cap and removed offshore destinations he did not want to serve, so no high-value item could blow the budget.

The result

Full Seller Central configuration delivered through child-user access, plus a shipping cost calculator and a written strategy guide showing exactly how every box size and region was priced. The framework applies to the whole catalogue and keeps working as new products are added.

Fast delivery where it wins the sale, predictable cost everywhere else. The two are not the same decision.

Source: client engagement, US marketplace, merchant-fulfilled.

Case 11  ·  International  ·  Seasonal campaign operations

120 ASINs, 22 marketplaces, one seasonal rhythm.

120

Priority international ASINs

22

Non-US Amazon marketplaces

12

Month campaign cycle

3

Primary product categories

The situation

A fashion jewellery brand selling birthstone, zodiac and crystal pieces across 22 non-US marketplaces. Demand rotates every month with the birthstone calendar, so campaign preparation, product selection, naming, launch timing and closure timing all had to stay consistent across two dozen countries at once. It was being run on scattered spreadsheets and manual checks.

What we did

  • Classified every focused ASIN by birthstone month, stone colour and category using title, variation, bullet and description evidence — and kept ambiguous products in a review queue rather than forcing an unreliable assignment.
  • Built a 12-month birthstone advertising calendar with campaigns prepared in the month before the relevant one, so seasonal launches stopped arriving late.
  • Designed a repeatable portfolio, campaign and ad-group naming convention that holds across every marketplace.
  • Separated campaign records, status, spend, sales and notes per country, so each market can be steered independently.

The result

One source of truth for seasonal campaign planning: faster monthly ASIN selection, consistent naming across marketplaces, clear launch and pause timing, visible classification quality, and independent control of each country's plan and results — reusable every year.

These are operational outcomes. No advertising performance improvement is claimed for this engagement.

Seasonal catalogues do not fail on strategy. They fail on being two weeks late, in eleven countries at once.

Source: client engagement. Brand and ASIN identifiers withheld.

On these numbers

How to read this page.

Every figure has a source

Each case names the dashboard it was read from — Seller Central, Amazon Ads campaign manager, or the account's Sellerboard P&L. Nothing here is modelled, projected or rounded up.

Names are withheld, numbers are not

Client names, ASINs and product titles are redacted because these are live commercial accounts. The performance data is unaltered.

Outliers are labelled as outliers

A 0.91% ACoS is not a service level. Where a result is exceptional we say so on the case itself, rather than letting it stand in for typical performance.

None of it is a forecast

These outcomes depend on category, competition, margin structure, seasonality and platform changes. Your account will produce its own numbers.

Next step

Find out which of these your account is.

Most accounts are one of the first three: profitable on paper, leaking underneath. The audit tells you which, in priority order, with the expected effect of fixing each one.

What you get

A written view of what is constraining profit, in priority order, with the expected effect of addressing each one.

What we need

Read access to advertising and business reports. No changes are made to your account during an audit.

What it is not

Not a sales call with a report attached. If your account does not need an agency yet, the audit will say so.

Supporting screenshot